
Percentiles:
In a set of observations, the value, below which a given percentage of observations fall, is called the percentile. Eg., 90th percentile is the value below which 90 % observations amongst the dataset can be found. It is an essential counter in scenarios where outliers (excessively high response time values in case of performance results) are found and impact the average response time of the transaction. Eg. If for a transaction, response time is 1 sec for 99 transactions and 100 sec for the 100th transaction. Then average response time is 2 sec but 90 percentile response times is 1 sec. Thus percentile neglects the effect of outliers that is observed in case of averages.
Normal values:
Normal values are the values in the dataset that repeat the most number of times in the dataset. It can also be defined as the number in the set of data that repeats the most frequently.
Eg., Let’s say we have following dataset –
19, 3, 3, 88, 21, 21, 88, 19, 19, 19
In this dataset, 15 occurs four times, 21 twice, 88 twice and 3 twice. Thus the mode of this observation-set is 19.
Averages:
Average is nothing but the mean of all the numbers in the observation set. We just add together all the data points and divide the total with the number of data points in the set. Eg., average of 3,4 & 5 is 4.
Medians:
Median means middle value. When all of the numbers in the list are arranged in ascending / descending order, the number that occurs in the middle is called the median of the observation set. In case of even number of values in the observation set, an average of middle two numbers is the median of the observation set.
Eg., Let’s say we have following dataset –
19, 3, 3, 88, 21, 21, 88, 19, 19, 19
In ascending order, the dataset can be written as –
3, 3, 19, 19, 19, 19, 21, 21, 88, 88
In this example, median is the average of two 19 which are the middle values in this series. Thus the median is 19.
Standard Deviations:
Standard deviation helps in understanding the dispersion or variation of all the data items from the average of the dataset. A higher standard deviation means that the data points are widely dispersed and a lower standard deviation indicates that those are spaced close to the average of the dataset.
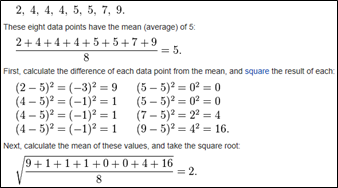
For a finite set of numbers, the standard deviation is found by taking the square root of the average of the squared differences of the values from their average value. Eg., For a dataset with following 8 values, SD can be calculated as –

***This snapshot is taken from Wikipedia page.
 Normal Distributions:
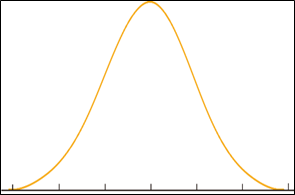
The most commonly observed distribution in practice wherein a continuous distribution probability function is followed. In this distribution the datasets are weighted towards the center (or median value) of the distribution. A normal distribution follows bell curve (pasted alongside). The smaller the distribution, the taller is the bell curve.
 Uniform distributions:
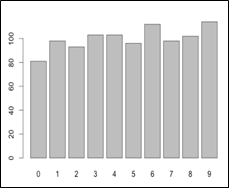
A set of random numbers evenly spaced between the upper and the lower bounds is said to follow uniform distribution. In case of a uniform distribution every number in the dataset is expected to occur at roughly the same number of times.
Outliers:
Any data point that is beyond 3 standard deviations or out of 99 percentile value for a dataset is an outlier for that dataset. Outliers in case of performance tests are sudden peaks that are observed in the tests and these can be because of many unexpected reasons. People in the domain tend to ignore such transactions; however I would suggest doing a brief analysis on why the outlier was observed before completely ignoring it. It might help you identify a performance issue.
Confidence Intervals:
It is an indicator used to highlight the reliability of an estimate. It is the probability that a value will fall between an upper and lower bound of a probability distribution. A 95% confidence interval for the log odds ratio is obtained as 1.96 standard errors on either side of the estimate.